1QFY2020 Result Update | Automobile
August 3, 2019
Ashok Leyland Ltd.
BUY
CMP
`64
Performance Update
Target Price
`93
(` cr)
1QFY20
1QFY19
% yoy 4QFY19
% qoq
Investment Period
12 months
Revenue
5,684
6,263
(9.2)
8,846
(35.7)
Stock Info
EBITDA
517
650
(20.5)
974
(46.9)
Sector
Automobile
OPM (%)
9.1
10.4
(129bp)
11.0
(191bp)
Market Cap (` cr)
18,905
Reported PAT
230
422
(45.4)
653
(64.7)
Net Debt (` cr)
3,611
Source: Company, Angel Research
Beta
1.1
For 1QFY2020, Ashok Leyland Ltd (ALL) posted disappointing results on both top-
52 Week High / Low
135/61
line and bottom-line fronts. Revenue de-grew by 9% yoy to `5,684cr. Further,
Avg. Daily Volume
14,43,371
operating margin contracted by 129bps. On the bottom-line front, ALL’s PAT
Face Value (`)
5
BSE Sensex
37,118
declined 45.4% yoy to `230cr on the back of lower sales and poor operating
Nifty
10,997
performance.
Reuters Code
ASOK.BO
Volume decline drags overall revenue: The company’s top-line de-grew by ~9%
Bloomberg Code
AL.IN
yoy to `5,684cr mainly due to 6% volume decline and ~3% decline in average
realizations. The company has reported subdued top-line growth mainly due to
Shareholding Pattern (%)
lower freight availability and delay in purchases led by confusion around GST
Promoters
51.1
reduction. ALL expects CV industry to report flattish growth due to slowdown in
MF / Banks / Indian
6.3
FII / NRIs / OCBs
18.8
economy and uncertainty around pre-buy ahead of BS-VI.
Indian Public/Others
23.8
PAT down 45% yoy: On the operating front, the company’s margins declined by
129bps yoy to 9.1% due higher discount provided by company (average M&HCV
Abs.(%)
3m
1yr
3yr
discounts during Q1FY2020 were at Rs3.5-4L/unit, flat qoq). However, PAT de-
Sensex
4.8
(0.1)
32.7
grew ~45% yoy to `230cr on the back of lower volumes, poor operating
ALL
(28.7)
(46.3)
(25.4)
performance and higher taxes.
Outlook and Valuation: During 1QFY2020, ALL’s volume growth remained
subdued due to overall slowdown in economy, lower freight availability and delay
in purchases led by confusion around GST. However, ALL has outperformed the
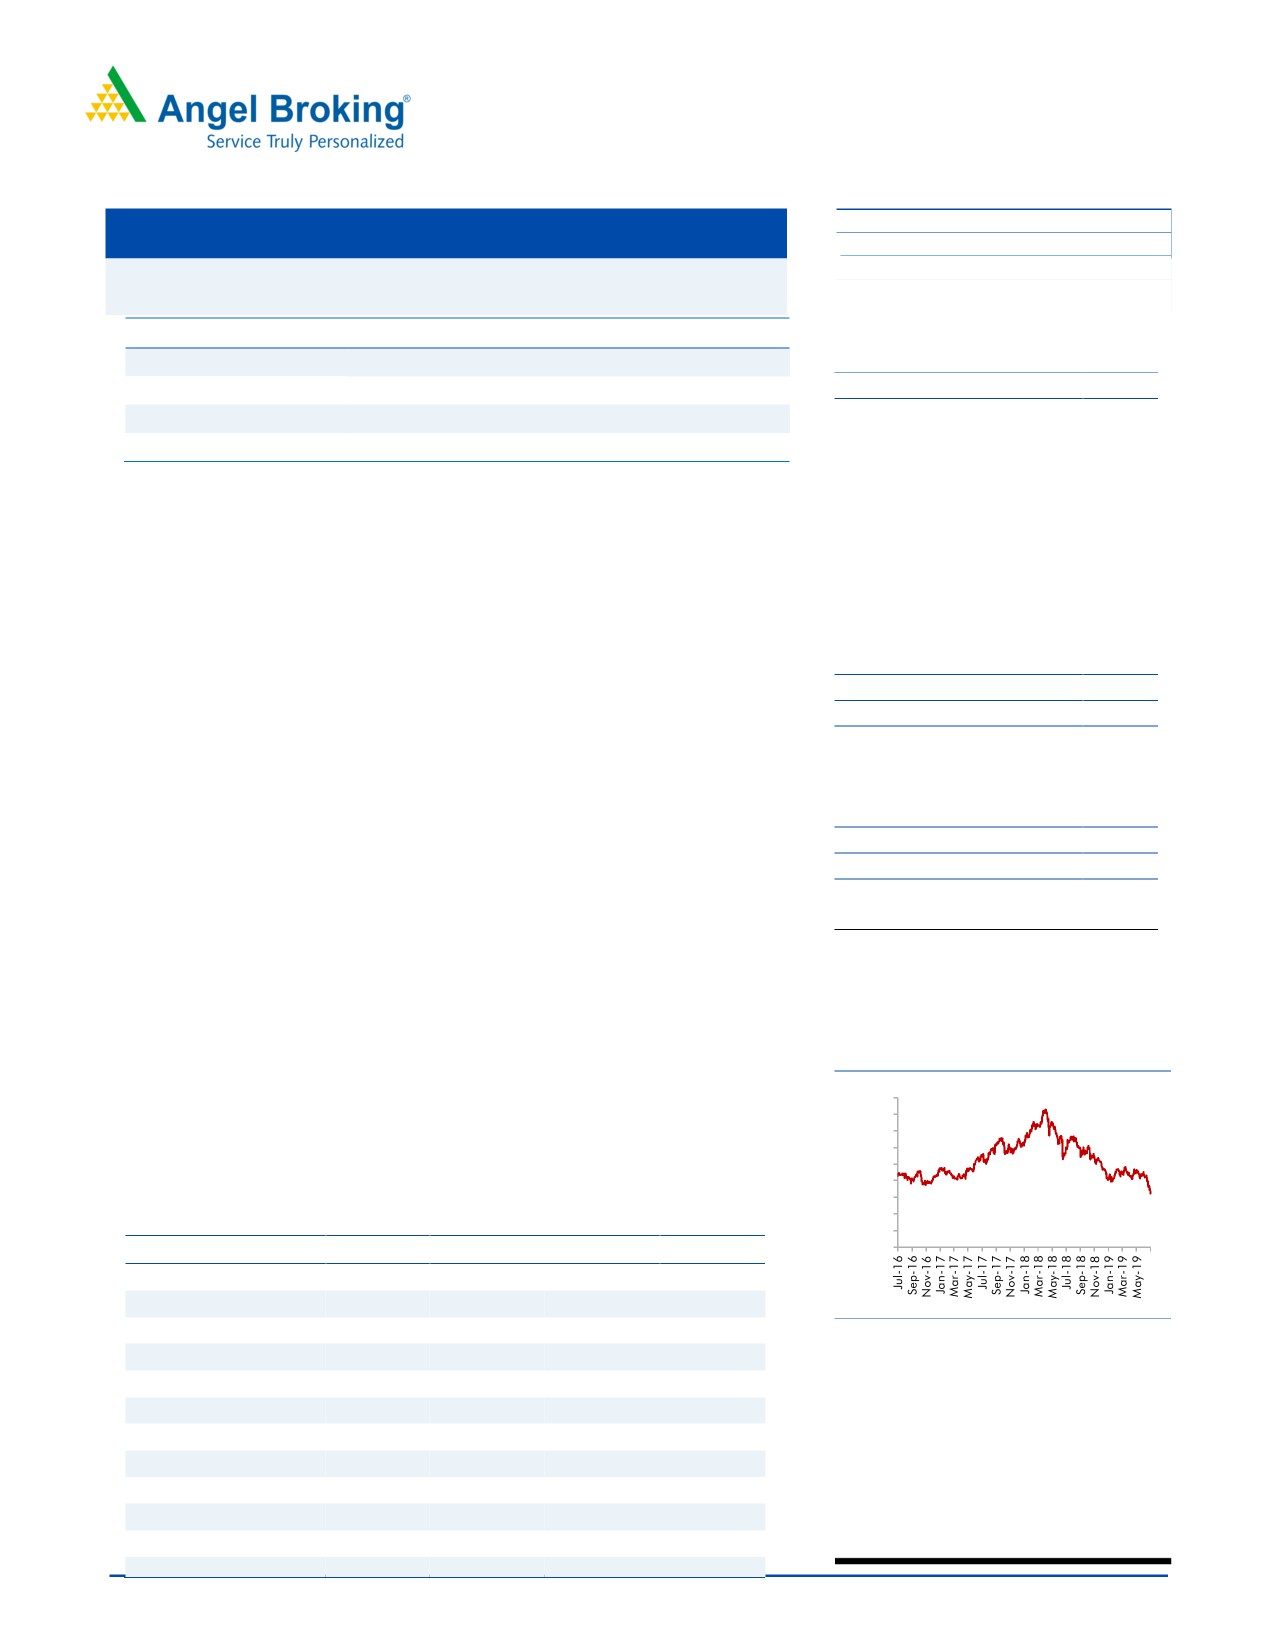
istorical share price chart
industry in 1QFY20. Further, we believe, any revival in CV industry (due pre-buying
ahead of BS-VI) would benefit ALL owing to its strong position in industry (market
180
160
share gains), diversified portfolio and strong brand & distribution network.
140
Considering the above factors, we maintain our Buy recommendation on ALL with
120
100
Target Price of `93.
80
60
Key Financials
40
20
Y/E March (` cr)
FY2018
FY2019
FY2020E
FY2021E
0
Net sales
26,356
29,055
29,847
32,381
% chg
31.7
10.2
2.7
8.5
Adj. Net profit
1,736
2,027
1,493
1,697
Source: Company, Angel Research
% chg
16.4
16.8
(26.4)
13.7
EBITDA margin (%)
10.2
10.6
9.6
9.9
Amarjeet S Maurya
EPS (`)
5.9
6.9
5.1
5.8
022-40003600 Ext: 6831
P/E (x)
10.9
9.3
12.6
11.1
P/BV (x)
2.6
2.3
2.1
1.9
RoE (%)
24.3
24.2
17.0
17.0
RoCE (%)
25.6
27.4
23.1
23.5
EV/Sales (x)
0.5
0.5
0.5
0.4
EV/EBITDA (x)
4.9
5.0
5.2
4.4
PlSource: Company, Angel Researchures at the end of this report
1
Ashok Leyland | 1QFY2020 Result Update
Exhibit 1: 1QFY2020 Performance
Y/E March (` cr)
1QFY20
1QFY19
% yoy
4QFY19
% qoq
FY19
FY18
% chg
Net Sales
5,684
6,263
(9.2)
8,846
(35.7)
29,055
26,356
10.2
Consumption of RM
3974
4,317
(8.0)
6,429
(38.2)
20,680
18,431
12.2
(% of Sales)
69.9
68.9
72.7
71.2
69.9
Staff Costs
500
500
0.1
573
(12.7)
2098.8
1837.8
14.2
(% of Sales)
8.8
8.0
6.5
7.2
7.0
Other Expenses
693
795
(12.9)
870
(20.3)
3,198
3,405
(6.1)
(% of Sales)
12.2
12.7
9.8
11.0
12.9
Total Expenditure
5,167
5,613
(7.9)
7,872
(34.4)
25,977
23,674
9.7
Operating Profit
517
650
(20.5)
974
(46.9)
3,078
2,683
14.8
OPM
9.1
10.4
11.0
10.6
10.2
Interest
13
14
(11.6)
17
(24.4)
70
147
(52.2)
Depreciation
165
152
8.0
160
3.1
621.0
598.5
3.8
Other Income
21
52
(59.8)
9
131.4
110
449
(75.5)
PBT (excl. Ext Items)
361
536
(32.7)
806
(55.3)
2,497
2,386
4.7
Ext (Income)/Expense
-
-
-
-
-
PBT (incl. Ext Items)
361
536
(32.7)
806
(55.3)
2,497
2,386
4.7
(% of Sales)
6.3
8.6
9.1
8.6
9.1
Provision for Taxation
131
114
14.2
153
(15.0)
514
668
(23.1)
(% of PBT)
36.2
21.3
19.0
20.6
28.0
Reported PAT
230
422
(45.4)
653
(64.7)
1,983
1,718
15.5
PATM
4.1
6.7
7.4
6.8
6.5
Extra-ordinary Items
(20)
(13)
(9)
(44)
(18)
Adjusted Profit After Extra-ordinary item
250
435
(42.5)
662
(62.2)
2,027
1,736
16.8
Source: Company, Angel Research
August 3, 2019
2
Ashok Leyland | 1QFY2020 Result Update
Outlook and Valuation
During 1QFY2020, ALL’s volume growth remained subdued due to overall
slowdown in economy, lower freight availability and delay in purchases led by
confusion around GST. However, ALL has outperformed the industry in 1QFY2020.
Further, we believe, any revival in CV industry( due pre-buying ahead of BS-VI) would
benefit ALL owing to its strong position in industry (market share gains), diversified
portfolio and strong brand & distribution network. Considering the above factors,
we maintain our Buy recommendation on ALL with Target Price of `93.
Downside risks to our estimates
Slowdown in industrial activities could restrict sales volume for ALL.
Delay in implementation of vehicle scrappage policy could restrict the
additional sales growth for the company.
Company Background
Ashok Leyland Ltd (ALL) is a holding company and is engaged in commercial
vehicles and related components. Through its subsidiaries, it is engaged in
manufacturing and trading in Medium and Heavy Commercial Vehicle (MHCV),
Light Commercial Vehicles (LCV), Passenger Vehicles (PV), automotive aggregates,
vehicle financing and engineering design services. It offers a range of 18 to 80
seater buses under categories such as city application and electric buses. It offers a
range of trucks, which includes long haul trucks, mining and construction trucks, and
distribution trucks. It designs, develops and manufactures defence vehicles for
armed forces. It offers Light Vehicles, which includes DOST, PARTNER, STiLE and
MiTR. It offers power solutions for electric power generation, agricultural harvester
combines, earth moving and construction equipment and marine and other non-
automotive applications. It has operations in India, Sri Lanka, Bangladesh,
Mauritius, the Middle East and Africa.
August 3, 2019
3
Ashok Leyland | 1QFY2020 Result Update
Standalone Profit & Loss Statement
Y/E March (` cr)
FY2017
FY2018
FY2019
FY2020E
FY2021E
Net Sales
20,019
26,356
29,055
29,847
32,381
% chg
5.7
31.7
10.2
2.7
8.5
Total Expenditure
18,341
23,674
25,977
26,982
29,176
Raw Material
13,973
18,431
20,680
21,341
23,153
Personnel
1,543
1,838
2,099
2,209
2,461
Others Expenses
2,825
3,405
3,198
3,432
3,562
EBITDA
1,677
2,683
3,078
2,865
3,206
% chg
16.5
59.9
14.8
(6.9)
11.9
(% of Net Sales)
8.4
10.2
10.6
9.6
9.9
Depreciation& Amortisation
518
598
621
694
729
EBIT
1,160
2,084
2,457
2,172
2,477
% chg
21.9
79.7
17.9
(11.6)
14.0
(% of Net Sales)
5.8
7.9
8.5
7.3
7.6
Interest & other Charges
155
147
70
54
54
Other Income
326
449
110
110
110
(% of PBT)
24.5
18.8
4.4
4.9
4.3
Recurring PBT
1,330
2,386
2,497
2,228
2,533
% chg
60.9
79.4
4.7
(10.8)
13.7
Tax
107
668
514
735
836
(% of PBT)
8.0
28.0
20.6
33.0
33.0
PAT (reported)
1,223
1,718
1,983
1,493
1,697
Extraordinary Items
(268)
(18)
(44)
-
-
ADJ. PAT
1,491
1,736
2,027
1,493
1,697
% chg
92.7
16.4
16.8
(26.4)
13.7
(% of Net Sales)
7.4
6.6
7.0
5.0
5.2
Basic EPS (`)
5.1
5.9
6.9
5.1
5.8
Fully Diluted EPS (`)
5.1
5.9
6.9
5.1
5.8
% chg
92.7
16.4
16.8
(26.4)
13.7
August 3, 2019
4
Ashok Leyland | 1QFY2020 Result Update
Standalone Balance Sheet
Y/E March (` cr)
FY2017
FY2018
FY2019
FY2020E FY2021E
SOURCES OF FUNDS
Equity Share Capital
285
293
294
293
293
Reserves& Surplus
5,841
6,861
8,065
8,496
9,664
Shareholders Funds
6,126
7,154
8,358
8,789
9,957
Total Loans
2,145
1,002
601
600
600
Deferred Tax Liability
741
726
927
726
727
Total Liabilities
9,012
8,882
9,886
10,115
11,284
APPLICATION OF FUNDS
Gross Block
5,858
6,312
7,594
7,994
8,394
Less: Acc. Depreciation
887
1,338
1,979
2,673
3,402
Net Block
4,971
4,974
5,615
5,321
4,992
Capital Work-in-Progress
206
401
658
401
401
Investments
2,879
5,803
2,637
2,774
2,774
Current Assets
5,744
5,408
9,316
9,851
11,817
Inventories
2,501
1,710
2,685
2,944
3,194
Sundry Debtors
860
980
2,506
2,126
2,307
Cash
912
1,004
1,374
1,647
2,431
Loans & Advances
709
1,120
1,623
1,642
1,943
Other Assets
762
593
1,129
1,492
1,943
Current liabilities
5,402
8,131
9,015
8,091
8,356
Net Current Assets
342
(2,723)
301
1,760
3,461
Deferred Tax Asset
614
427
677
427
428
Mis. Exp. not written off
-
-
-
-
-
Total Assets
9,012
8,882
9,886
10,115
11,284
August 3, 2019
5
Ashok Leyland | 1QFY2020 Result Update
Standalone Cashflow Statement
Y/E March (Rs cr)
FY2017
FY2018
FY2019
FY2020E FY2021E
Profit before tax
1223
1718
1983
2228
2533
Depreciation
518
598
621
694
729
Change in Working Capital
190
2969
(2964)
(1186)
(917)
Interest / Dividend (Net)
88
93
31
0
0
Direct taxes paid
(348)
(427)
(560)
(735)
(836)
Others
484
692
527
0
0
Cash Flow from Operations
2155
5643
(362)
1000
1509
(Inc.)/ Dec. in Fixed Assets
(366)
(534)
(731)
(400)
(400)
(Inc.)/ Dec. in Investments
(1111)
(2895)
3043
0
0
Cash Flow from Investing
(1477)
(3429)
2312
(400)
(400)
Issue of Equity
0
0
9
0
0
Inc./(Dec.) in loans
(883)
(1378)
(662)
(1)
0
Dividend Paid (Incl. Tax)
(325)
(549)
(860)
(325)
(325)
Interest / Dividend (Net)
(151)
(190)
(94)
0
0
Cash Flow from Financing
(1359)
(2118)
(1608)
(327)
(325)
Inc./(Dec.) in Cash
(681)
96
342
273
784
Opening Cash balances
1593
908
1031
1374
1647
Closing Cash balances
912
1004
1374
1647
2431
August 3, 2019
6
Ashok Leyland | 1QFY2020 Result Update
Key Ratios
Y/E March
FY2017
FY2018
FY2019
FY2020E FY2021E
Valuation Ratio (x)
P/E (on FDEPS)
12.6
10.9
9.3
12.6
11.1
P/CEPS
10.8
8.1
7.2
8.6
7.8
P/BV
3.1
2.6
2.3
2.1
1.9
Dividend yield (%)
1.7
0.0
0.0
0.0
0.0
EV/Sales
0.9
0.5
0.5
0.5
0.4
EV/EBITDA
10.3
4.9
5.0
5.2
4.4
EV / Total Assets
1.9
1.5
1.6
1.5
1.3
Per Share Data (Rs)
EPS (Basic)
5.1
5.9
6.9
5.1
5.8
EPS (fully diluted)
5.1
5.9
6.9
5.1
5.8
Cash EPS
5.9
7.9
8.9
7.5
8.3
DPS
1.1
0.0
0.0
0.0
0.0
Book Value
20.9
24.4
28.6
30.0
34.0
Returns (%)
ROCE
14.0
25.6
27.4
23.1
23.5
Angel ROIC (Pre-tax)
25.9
154.4
49.6
43.7
46.3
ROE
24.3
24.3
24.2
17.0
17.0
Turnover ratios (x)
Asset Turnover (Gross Block)
3.4
4.2
3.8
3.7
3.9
Inventory / Sales (days)
46
24
34
36
36
Receivables (days)
16
14
31
26
26
Payables (days)
56
66
60
60
60
Working capital cycle (ex-cash) (days)
5
(29)
5
2
2
Source: Company, Angel Research
August 3, 2019
7
Ashok Leyland | 1QFY2020 Result Update
Research Team Tel: 022 - 39357800
DISCLAIMER
Angel Broking Limited (hereinafter referred to as “Angel”) is a registered Member of National Stock Exchange of India Limited, Bombay
Stock Exchange Limited and Metropolitan Stock Exchange Limited. It is also registered as a Depository Participant with CDSL and Portfolio
Manager and Investment Adviser with SEBI. It also has registration with AMFI as a Mutual Fund Distributor. Angel Broking Limited is a
registered entity with SEBI for Research Analyst in terms of SEBI (Research Analyst) Regulations, 2014 vide registration number
INH000000164. Angel or its associates has not been debarred/ suspended by SEBI or any other regulatory authority for accessing
/dealing in securities Market. Angel or its associates/analyst has not received any compensation / managed or co-managed public
offering of securities of the company covered by Analyst during the past twelve months.
This document is solely for the personal information of the recipient, and must not be singularly used as the basis of any investment
decision. Nothing in this document should be construed as investment or financial advice. Each recipient of this document should make
such investigations as they deem necessary to arrive at an independent evaluation of an investment in the securities of the companies
referred to in this document (including the merits and risks involved), and should consult their own advisors to determine the merits and
risks of such an investment.
Reports based on technical and derivative analysis center on studying charts of a stock's price movement, outstanding positions and
trading volume, as opposed to focusing on a company's fundamentals and, as such, may not match with a report on a company's
fundamentals. Investors are advised to refer the Fundamental and Technical Research Reports available on our website to evaluate the
contrary view, if any
The information in this document has been printed on the basis of publicly available information, internal data and other reliable sources
believed to be true, but we do not represent that it is accurate or complete and it should not be relied on as such, as this document is for
general guidance only. Angel Broking Limited or any of its affiliates/ group companies shall not be in any way responsible for any loss
or damage that may arise to any person from any inadvertent error in the information contained in this report. Angel Broking Limited
has not independently verified all the information contained within this document. Accordingly, we cannot testify, nor make any
representation or warranty, express or implied, to the accuracy, contents or data contained within this document. While Angel Broking
Limited endeavors to update on a reasonable basis the information discussed in this material, there may be regulatory, compliance, or
other reasons that prevent us from doing so.
This document is being supplied to you solely for your information, and its contents, information or data may not be reproduced,
redistributed or passed on, directly or indirectly.
Neither Angel Broking Limited, nor its directors, employees or affiliates shall be liable for any loss or damage that may arise from or in
connection with the use of this information.
Disclosure of Interest Statement
Ashok Leyland
1. Financial interest of research analyst or Angel or his Associate or his relative
No
2. Ownership of 1% or more of the stock by research analyst or Angel or associates or relatives
No
3. Served as an officer, director or employee of the company covered under Research
No
4. Broking relationship with company covered under Research
No
Ratings (Returns):
Buy (> 15%)
Accumulate (5% to 15%)
Neutral (-5 to 5%)
Reduce (-5% to -15%)
Sell (< -15%)
August 3, 2019
8